How we measure what works.
The homepage headline number (61.3% win rate · 2.75 profit factor · +47.1R · 6.3R max drawdown) comes from a single row in the table below: Trding Fire, Default preset with Zone Proximity Filter, SOXL 1-hour bars, May 2023 – April 2026 (~2 years, 62 trades). This page shows every other preset we’ve measured so you can see how the same engine performs across timeframes, trade counts, and filter settings. Nothing is hidden.
How to read these results
Every row is one backtest run of the Trding Fire indicator against historical price data for a single ticker (SOXL) at a single timeframe. The engine enters when its 0-10 Trding Score clears the preset’s minimum threshold, sets a stop at the ATR-derived level, and scales out across three take-profit targets. Every “R” in the total return column is one unit of initial risk — so +10.1R means the cumulative winning R-multiples exceeded the cumulative losing R-multiples by 10.1 units of risk. A preset with 20 trades that yields +10R is, on average, risking $1 to make 50 cents per trade.
Three metrics matter together, not individually:
- Trade count — a preset with 5 trades isn’t trustworthy no matter how great the win rate looks. Anything under ~20 trades is a signal of “interesting, needs more data,” not “proven.”
- Win rate — the percentage of trades that closed at a take-profit rather than a stop. A 40% win rate with a 2:1 reward:risk preset is still profitable.
- Profit factor — total winning R divided by total losing R. Greater than 1.0 is profitable; greater than 1.5 is strong.
Daily timeframe — SOXL, April 2024 to April 2026 (500 bars)
The daily timeframe is our longest-window dataset. Among the daily presets, Aggressive at min_score 4 is the only row with both a meaningful trade count and a positive expectancy. The Swing rows show that stricter confluence filters produce too few trades to be statistically meaningful at this timeframe.
| Preset | Min Score | Trades | Win Rate | Profit Factor | Total R | Max DD (R) |
|---|---|---|---|---|---|---|
| Swing | 6 | 3 | 66.7% | 1.84 | +1.4R | 1.6R |
| Swing | 5 | 9 | 33.3% | 0.85 | −1.1R | 3.4R |
| Swing | 4 | 10 | 30.0% | 0.79 | −1.6R | 3.4R |
| Aggressive | 4 | 25 | 52.0% | 1.68 | +10.1R | 7.9R |
| Default | 4 | 22 | 40.9% | 1.13 | +2.1R | 7.9R |
| Default | 3 | 22 | 40.9% | 1.13 | +2.1R | 7.9R |
Intraday — more trades, tighter windows
Intraday timeframes generate many more trades, which is both the opportunity and the risk: more data points for statistical significance, but also shorter historical windows (Yahoo Finance caps 15-minute bars at 60 days and hourly bars at roughly 2 years).
5-minute bars — last 60 days (Feb to April 2026)
| Preset | Trades | Win Rate | Profit Factor | Total R | Max DD (R) |
|---|---|---|---|---|---|
| Scalping | 246 | 59.8% | 2.34 | +165.0R | 7.4R |
| Aggressive | 182 | 56.6% | 2.23 | +108.8R | 8.4R |
15-minute bars — last 60 days (Feb to April 2026)
| Preset | Trades | Win Rate | Profit Factor | Total R | Max DD (R) |
|---|---|---|---|---|---|
| Default | 41 | 53.7% | 1.74 | +17.0R | 6.1R |
| Aggressive | 44 | 45.5% | 1.64 | +15.6R | 6.7R |
30-minute bars — last 60 days (Feb to April 2026)
| Preset | Trades | Win Rate | Profit Factor | Total R | Max DD (R) |
|---|---|---|---|---|---|
| Default | 19 | 52.6% | 1.94 | +10.7R | 5.5R |
| Aggressive | 21 | 57.1% | 2.04 | +13.8R | 5.3R |
1-hour bars — May 2023 to April 2026 (~2 years, 5,074 bars) — homepage row
| Preset | Trades | Win Rate | Profit Factor | Total R | Max DD (R) |
|---|---|---|---|---|---|
| Default + Zone Proximity Filter ← headline | 62 | 61.3% | 2.75 | +47.1R | 6.3R |
| Default (no filter) | 167 | 53.9% | 1.74 | +72.9R | 15.0R |
| Aggressive (no filter) | 223 | 53.8% | 1.58 | +85.8R | 11.8R |
Out-of-sample validation — tested on data the system never saw
The tables above are measured in-sample — on the windows we used to study the engine. The fair question any serious trader asks is: does the edge hold up on data the system wasn’t measured on? To answer it, we ran the exact same Trding Fire engine (ke_backtester.py) on two windows outside our published data — one that comes after our cutoff, and one that predates it entirely. Same engine, same presets, no re-tuning.
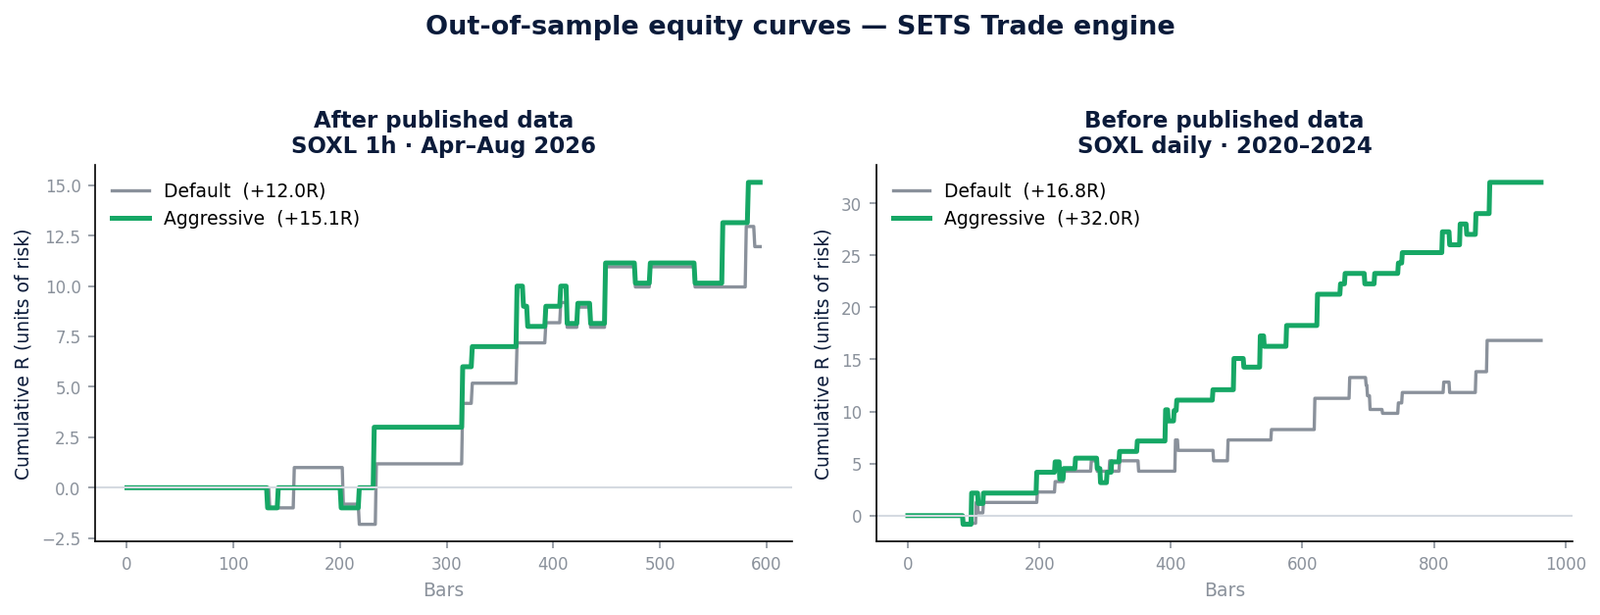
After the published data — SOXL 1-hour, April 2026 to present
This window is entirely after the data behind our homepage number, so the engine had no exposure to it.
| Preset | Trades | Win Rate | Profit Factor | Total R | Max DD (R) |
|---|---|---|---|---|---|
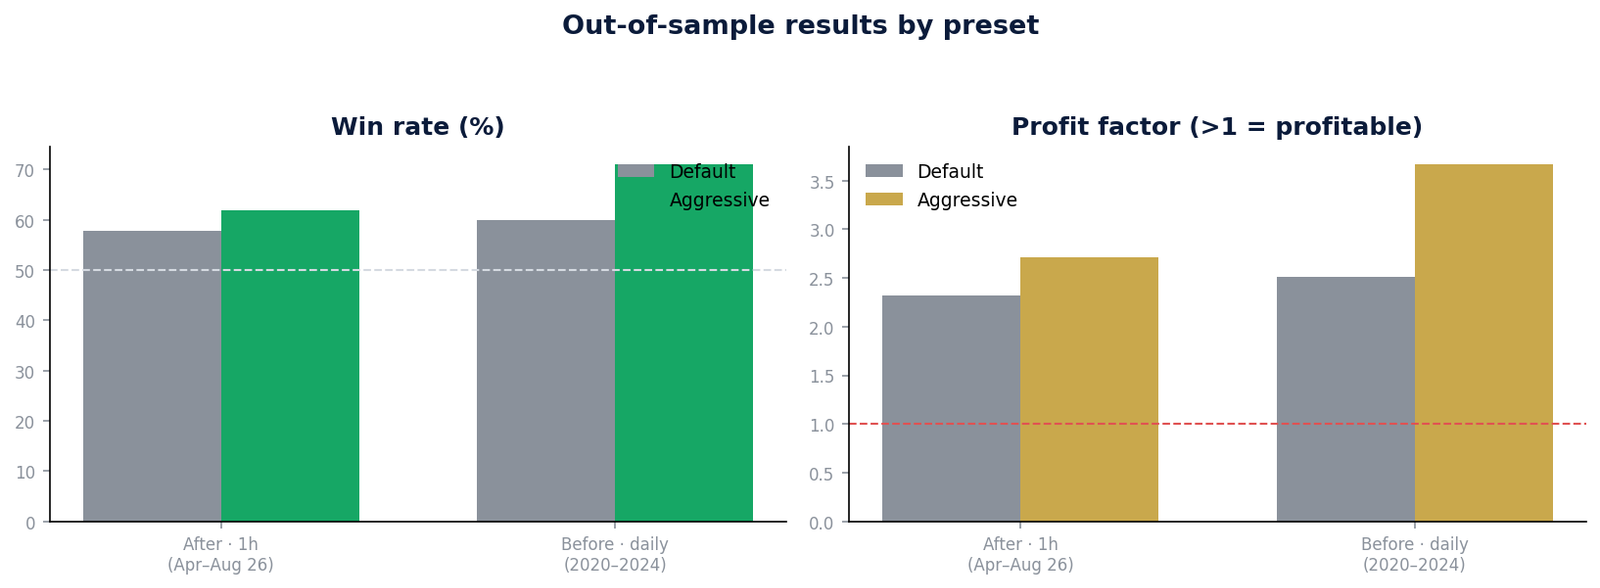
| Aggressive | 21 | 61.9% | 2.71 | +15.1R | 2.0R |
| Default | 19 | 57.9% | 2.32 | +12.0R | 2.8R |
| Conservative | 4 | — | — | — | — |
Before the published data — SOXL daily, 2020 to early 2024
This window predates our published daily study and includes the 2022 bear market — a genuine stress test across a full regime change.
| Preset | Trades | Win Rate | Profit Factor | Total R | Max DD (R) |
|---|---|---|---|---|---|
| Aggressive | 38 | 71.1% | 3.67 | +32.0R | 2.4R |
| Default | 30 | 60.0% | 2.51 | +16.8R | 3.4R |
| Conservative | 3 | — | — | — | — |
What this does — and does not — show
The point isn’t any single number; it’s consistency. The Aggressive preset held a 62–71% win rate and a 2.7–3.7 profit factor on data both before and after our published window — strong evidence the edge is a real characteristic of the engine, not a curve fit to one lucky stretch.
In the interest of the same transparency as the rest of this page:
- Conservative is not shown as a result. It produced only 3–4 trades in these windows — below our own ~20-trade threshold for statistical meaning. We’re reporting that honestly rather than dressing up a tiny sample.
- These are the base presets, without the Zone Proximity Filter — comparable to the “no filter” rows above, not the filtered headline row.
- Sample sizes are modest (19–38 trades). Read these as “the edge persisted out-of-sample,” not as a precise forward estimate.
What we picked for the homepage and why
We could have picked any of these rows to put on the front page. The 5-minute Scalping preset has the largest trade count (246). The 1-hour Aggressive row has the longest market history with 200+ trades. We picked the 1-hour Default preset with the Zone Proximity Filter enabled for four reasons:
- Highest profit factor of any row in the dataset. 2.75 means the system makes $2.75 for every $1.00 it loses — a 175% edge per dollar at risk. That’s the metric institutional traders care about most.
- Lowest max drawdown of any row with 60+ trades. 6.3R is significantly tighter than the unfiltered 1-hour rows (11.8R–15.0R) and the 5-minute rows (7.4R–8.4R). Lower drawdown means the system is easier to stay disciplined with through losing streaks.
- The Zone Proximity Filter encodes the 6-Step methodology directly. It rejects setups where price isn’t within reach of a Profit Zone — the same discipline a the methodology-trained trader applies manually. The trade count drops from 167 to 62 because most trades the unfiltered system takes shouldn’t have been taken; the filter removes them. What remains is higher quality.
- Two-year window captures real market regimes. The 2024–2026 window includes both trending and chopping conditions, so the 6.3R max drawdown reflects what the system actually did across regime changes — not what it did in a constructive 60-day stretch.
Tradeoffs worth naming: 62 trades is a smaller sample than the 5-minute Scalping row (246 trades) or the 1-hour Aggressive row (223 trades). For traders who prioritize trade frequency, those are the rows to study. The methodology behind the filter is documented on the methodology page; the results page shows the real backtest math and reproducibility notes.
Reproducing these numbers yourself
Every result on this page comes from cloud/ke_backtester.py, a faithful Python translation of the Pine Script v2.0.0 Trding Fire engine. It replicates EMA crossover entries, the 0-10 Trding Score, ATR-derived stop-loss with optional structure-based SL, three take-profit levels, and trailing stops. If you want to reproduce a row, point the backtester at the same ticker, interval, and preset parameters — the numbers should match within rounding.