One reading pattern.
Six indicators. Zero guesswork.
Most trading tools throw numbers at you. Trding gives you a reading rhythmdecision frameworkvisual grammarmethodology. Learn to read one dashboard, and you can read every indicator in the suite — because they all follow the same four-block pattern.
Why consistency beats complexity
Trading platforms love to add features. We built something harder: a visual grammar that works the same way everywhere.
Faster learning curve
New subscribers stop googling "what does this number mean?" by their second week. The pattern teaches itself.
Faster scanning
Your eye knows where to look. Hero number first, synopsis second, breakdown only if you want the "why." Three-second decisions become possible.
Zero cognitive load
Every indicator answers one question. Every dashboard reads the same way. No mode-switching between tools.
Methodology enforced visually
The 6-step Trding methodology isn't a page in a PDF — it's baked into how every dashboard is organized. Read left-to-right, top-to-bottom, you're executing the framework.
The four-block pattern
Every Trding dashboard is organized into exactly four blocks. Learn these once, read anything.
1 · STATE
A color-coded pill at the top. Green = active, worth watching. Muted = sit on your hands. One glance tells you if this indicator deserves attention this second.
2 · HERO
The big center number — the single value that captures what this indicator is telling you. Trend strength, momentum consensus, zone count, Trding Score. One number, massive type, impossible to miss.
3 · BREAKDOWN
The ingredients. You only need this when you want to understand the "why" behind the hero — otherwise your eye skips it.
4 · SYNOPSIS
A single plain-English sentence. No jargon. No math. Just the takeaway. If you read nothing else, read this.
One pattern. Six dashboards.
The same four blocks applied six different ways — each answering one question in the Trding 6-step methodology.
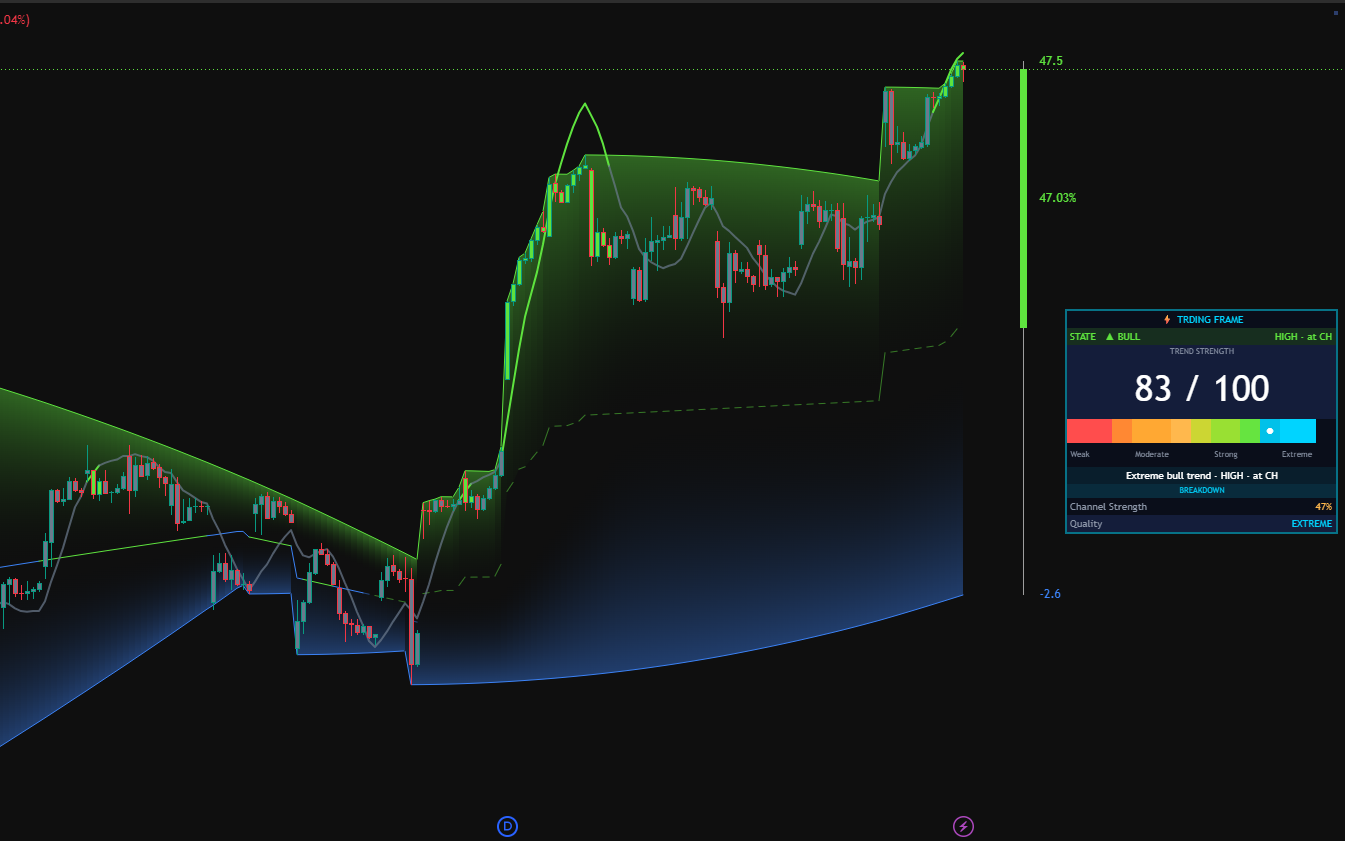
Trding Frame
The first step. Before anything else matters, we check whether this ticker is in a definable trend — up, down, or sideways. The hero number is a 0-100 trend strength score, with a gradient gauge showing exactly where the current ticker sits on the spectrum.
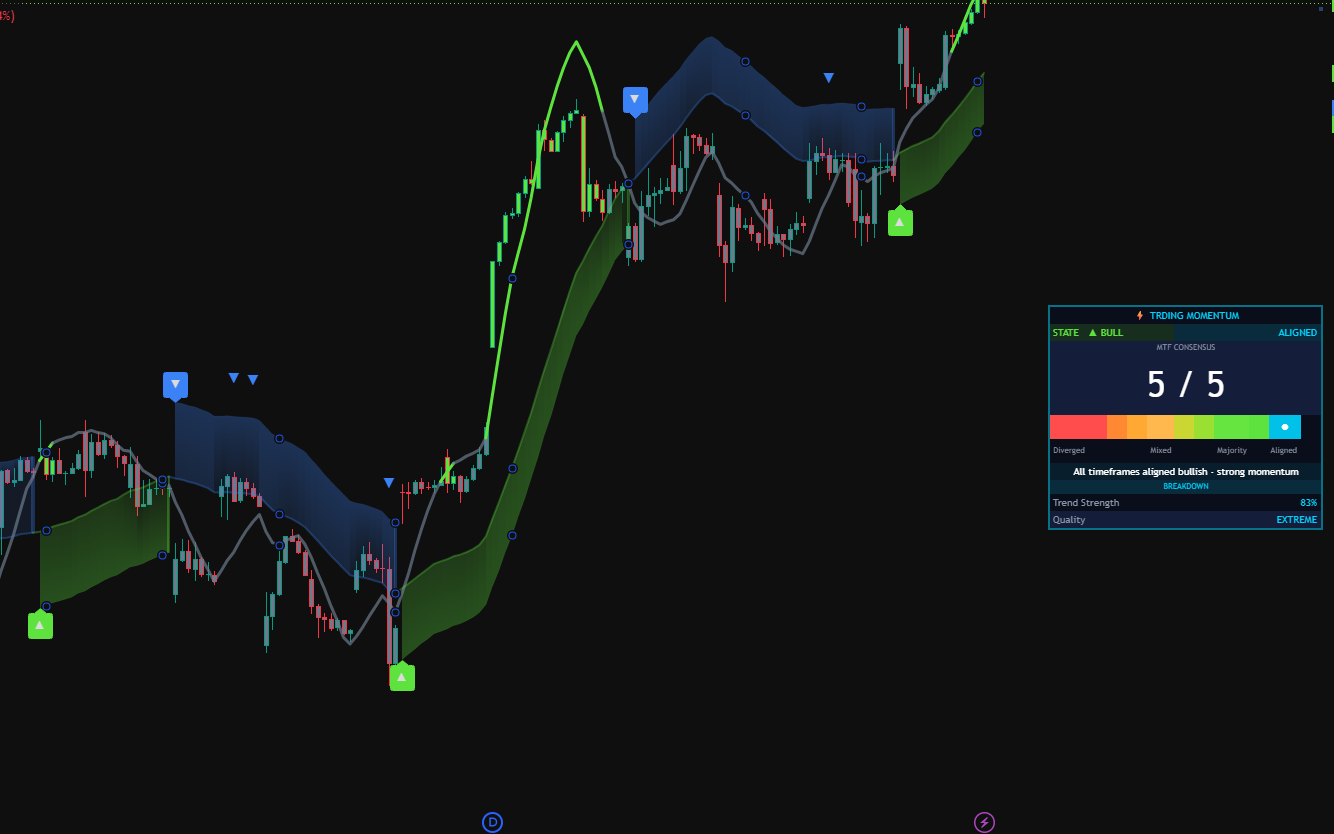
Trding Momentum
Trend direction is only half the story. The question Momentum answers: are the other timeframes agreeing? If the 1H trend is bullish but the 15m, 1H, 4H, 1D, and 1W all say "down," you don't have confluence — you have a trap. The hero number is a 0/5 agreement score across five timeframes.
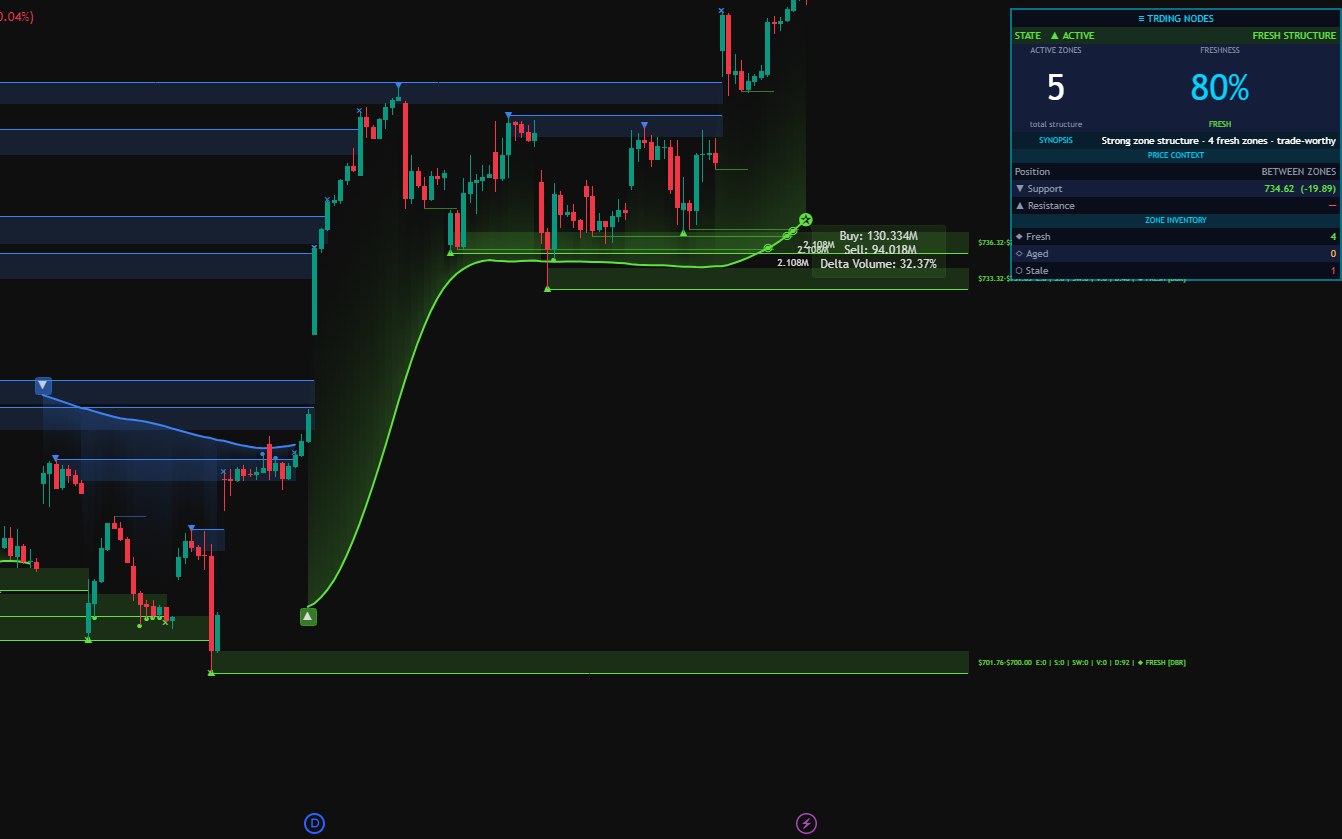
Trding Nodes
Trend tells you what. Momentum tells you when. Nodes tells you where — the specific price levels where buyers and sellers have fought before, and are likely to fight again. Two hero cards: active zone count and freshness %. The PRICE CONTEXT section tells you exactly where you stand vs structure right now.
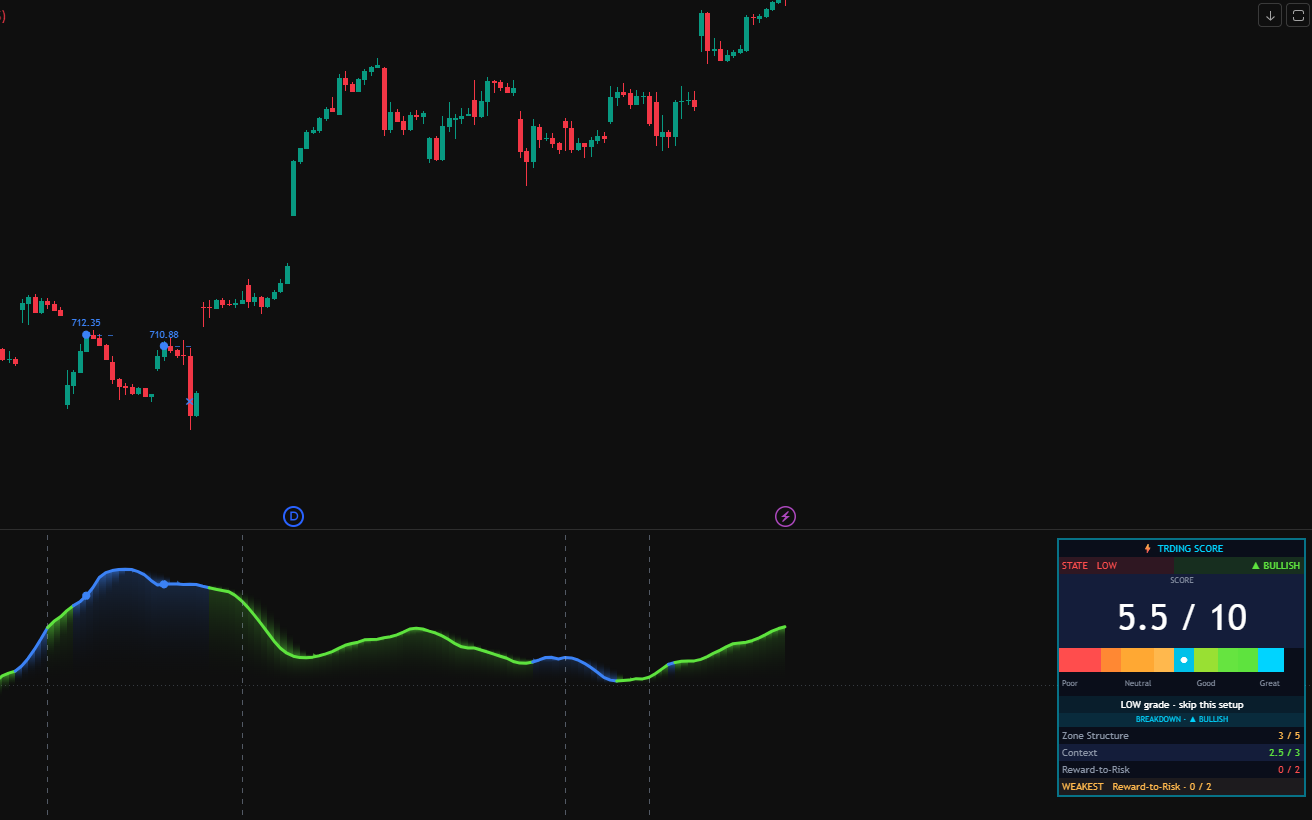
Trding Score
All three prior answers roll up into one number. The Trding Score (0-10) grades the setup across six factors — strength, time, freshness, trend, curve, and reward-to-risk — and tells you if the setup is proximal-entry quality (≥8.5), confirmation-entry quality (7-8), or a pass (<7). The gauge makes the grade visually instant.
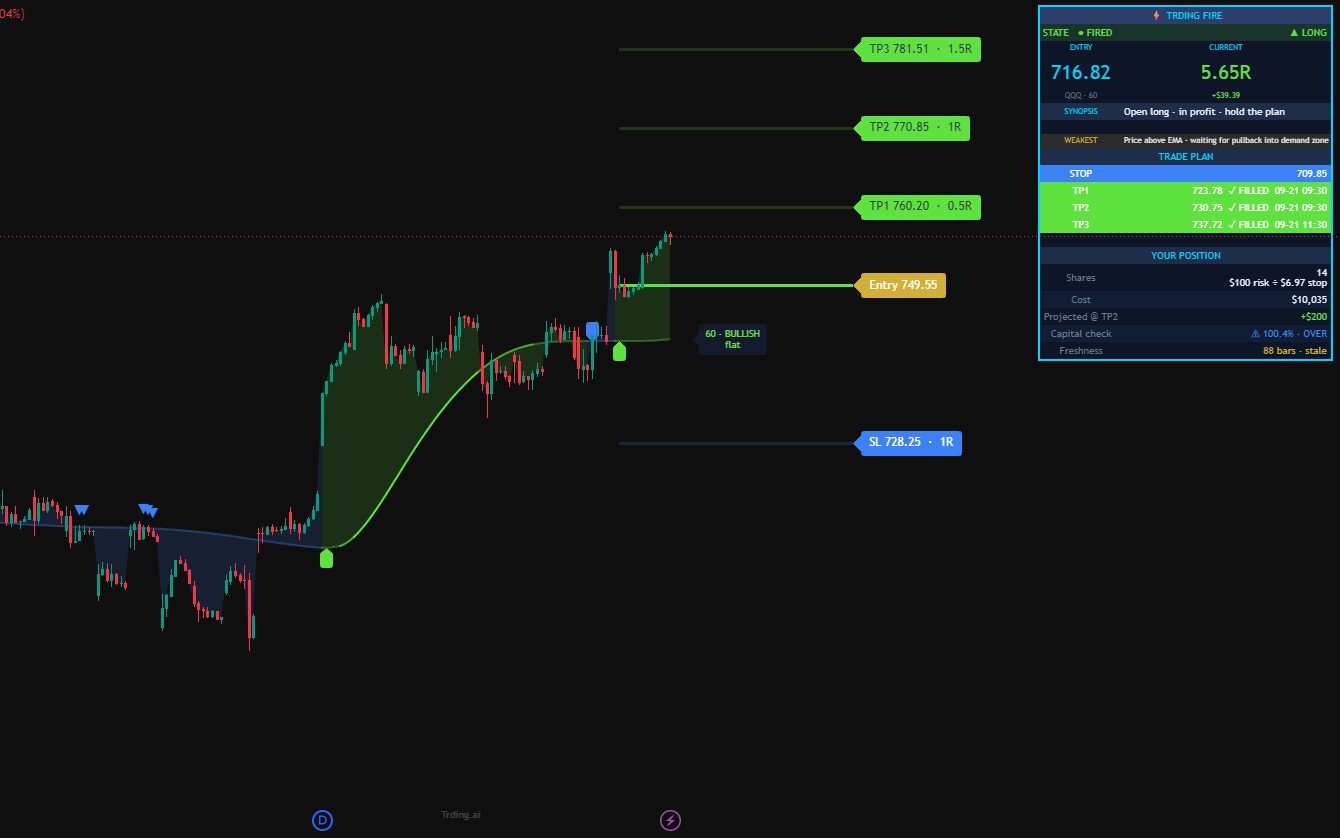
Trding Fire
The execution layer. Fire takes the first four indicators' answers and fires an actual trade signal — entry, stop, three targets, and reward-to-risk. Hero shows your entry price and R:R to TP2. The TRADE PLAN section lays out exactly what you'll be in. When position is live, YOUR POSITION tracks it in real time.
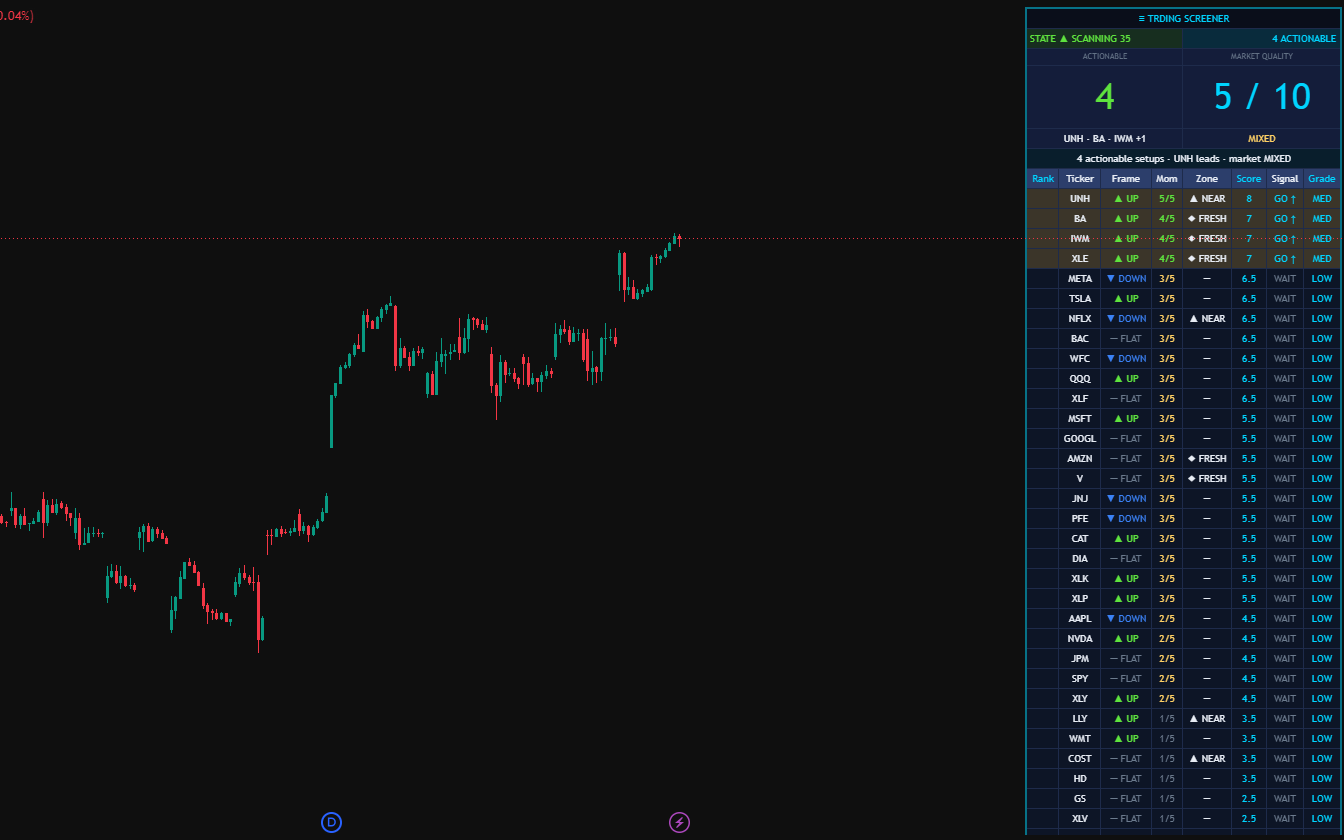
Trding Screener
The radar. The Screener runs the full Trding methodology across your entire watchlist — up to 40 tickers simultaneously — and surfaces the actionable setups. Hero: how many tickers are tradeable right now. Below: an 8-column table sorted by Score, with Rank badges on the top 3 HIGH-grade setups. Open ONLY the charts that matter.
How the six indicators cover the full methodology
The Trding 6-step methodology maps 1:1 to the six indicators. Each one owns one step.
The Screener runs steps 1-4 across your entire watchlist in parallel — so you know where to look before you open any chart.
What this design unlocks for you
We didn't rebuild all seven dashboards to look pretty. We rebuilt them to compress the time between "chart loads" and "I know what to do."
Three-second scanning
The hero number tells you the answer. The synopsis tells you what to do. If you want the "why," the breakdown is right there.
One pattern to learn
Memorize the four blocks once. Every indicator becomes readable. New Trding tools we ship follow the same pattern.
Six steps, visually enforced
The methodology is baked into the layout. Read left-to-right, you're executing the framework.
Ready to see it in action?
Get the full six-indicator suite plus the automated execution layer. One reading pattern. Full methodology. Live on your chart.
Get started →